Have implied volatilities bottomed out yet? |
A more positive tone pointing to some tentative progress in the negotiations between Ukraine and Russia was met with enthusiasm by traders. European indices showed the best performance over the day, with the German DAX up almost 3%. Implied volatilities were also under pressure in Europe with 30d IVX for the DAX closing about 3.5 points lower on the day. |
In the United States, the risk-on tone continued with the SPX and NDX gaining more than 1%. 30d IVX dropped by the pace slowed down and it finished the day about 0.5 points lower for both indices. |
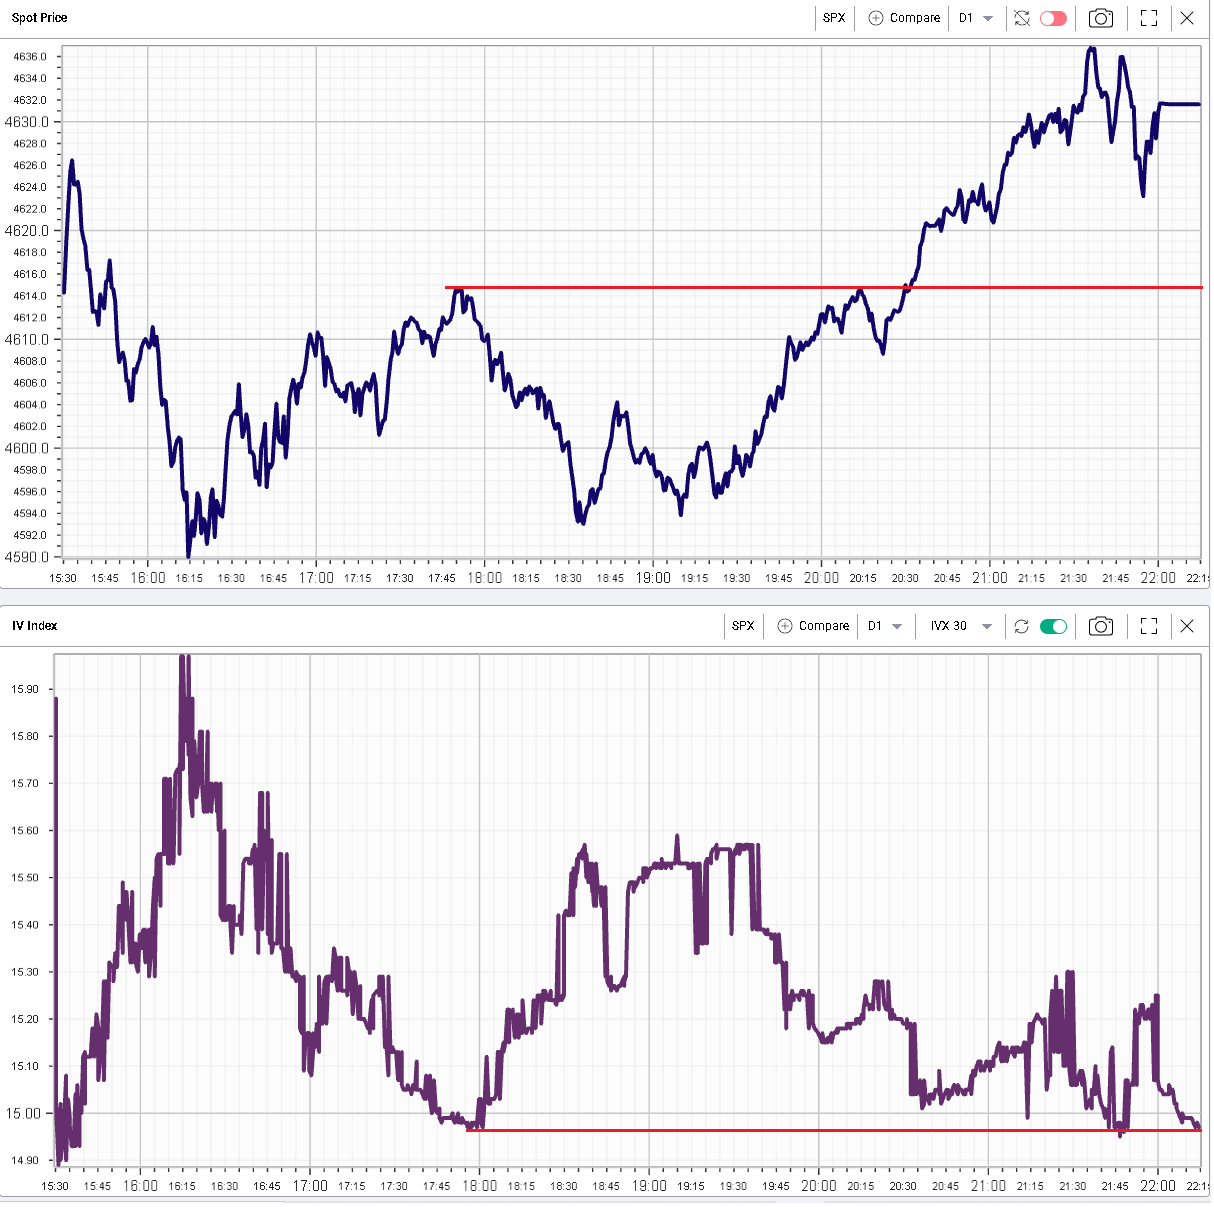
Looking at the intraday price action both on spot and IVX, it looks like implied volatility found a support, with the 30d IVX failing to break the 15% mark despite spot marching on to make new highs. |
|
Looking at the sector level, the energy space was the only that finished the day lower as oil continued to correct on the back of possible positive developments in Eastern Europe. The sector was down about 0.3%. The technology space on the other hand was fairly strong closing more than 2% higher. Interestingly the IVX in the space was very resilient and finished unchanged on the day. |
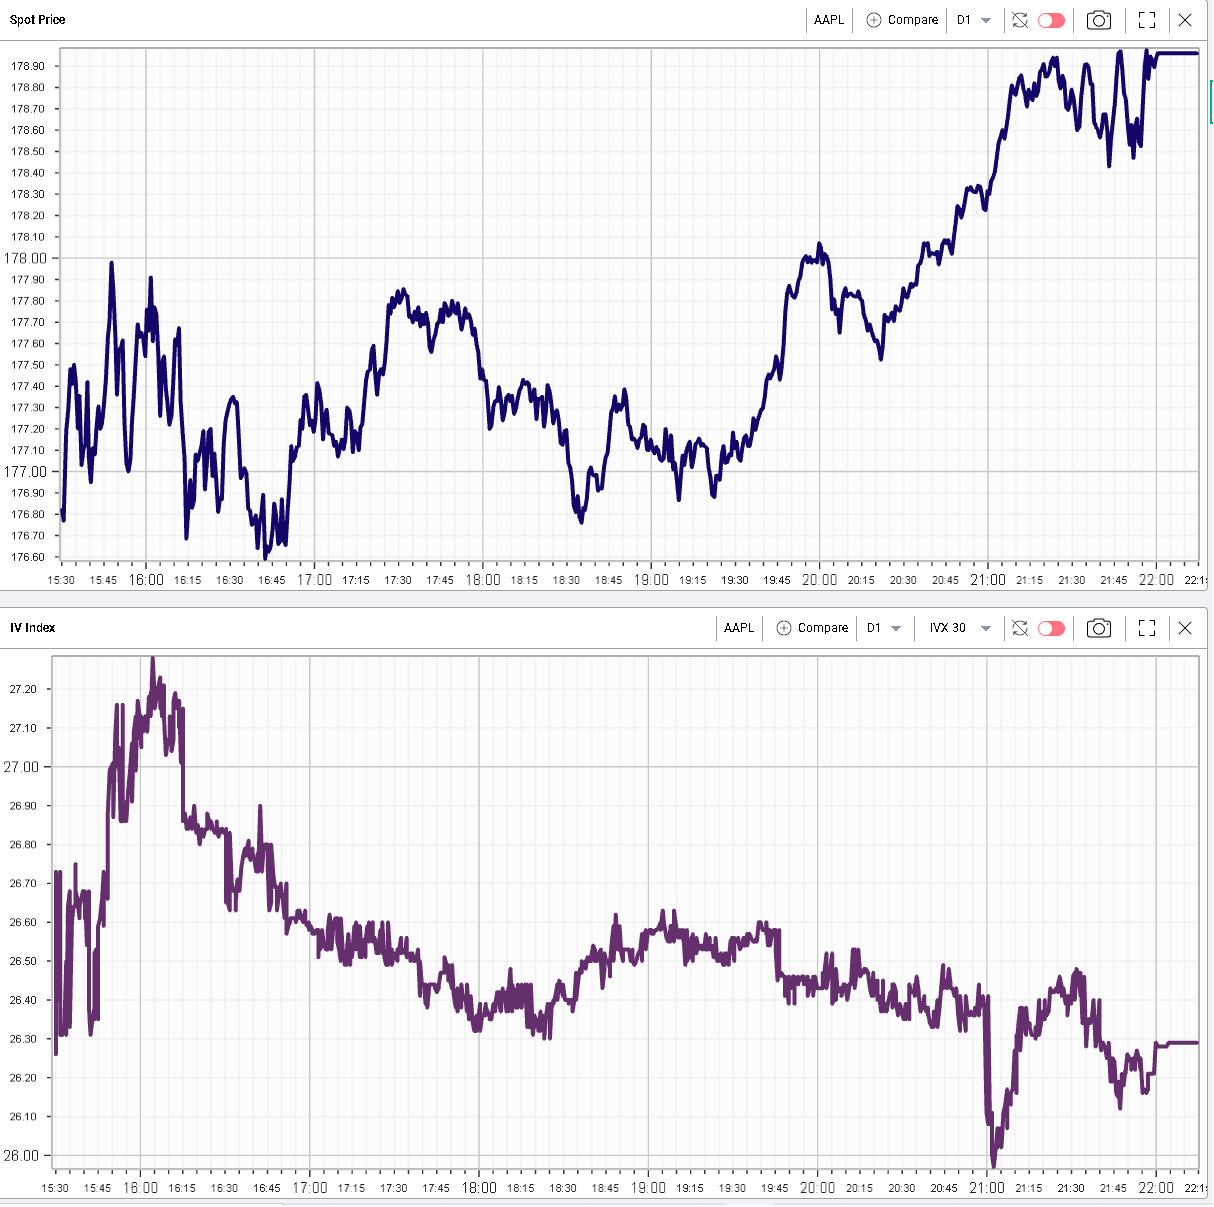
AAPL was a good example of the general mood in the tech space yesterday, closing at its highs while the implied volatility remained firm. |
|
Within the DJIA, NKE was one of the top performers for the day finishing higher by more than 3% and losing about 2 points on its 30d IVX. V was the best performing stock up by 3.3% on the day. |
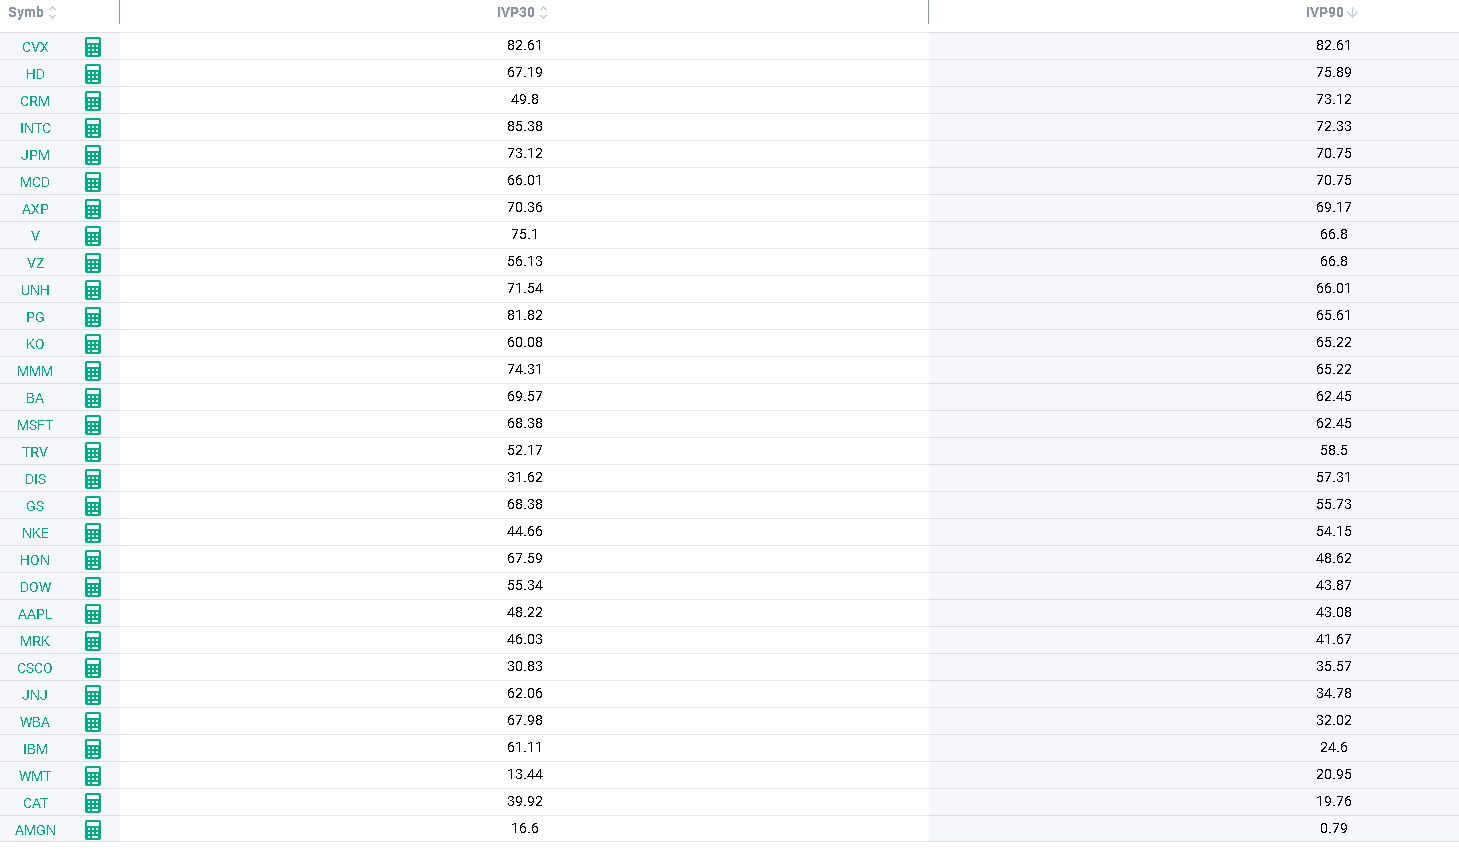
Looking at the current percentile of DJIA components, we can see that not all stocks are treated equally by market makers at the moment. This is particularly true for longer dated maturities (90d and further). |
For the next month, implied volatilities remain on the higher end compared to their own history but things are more spread further out. |
|
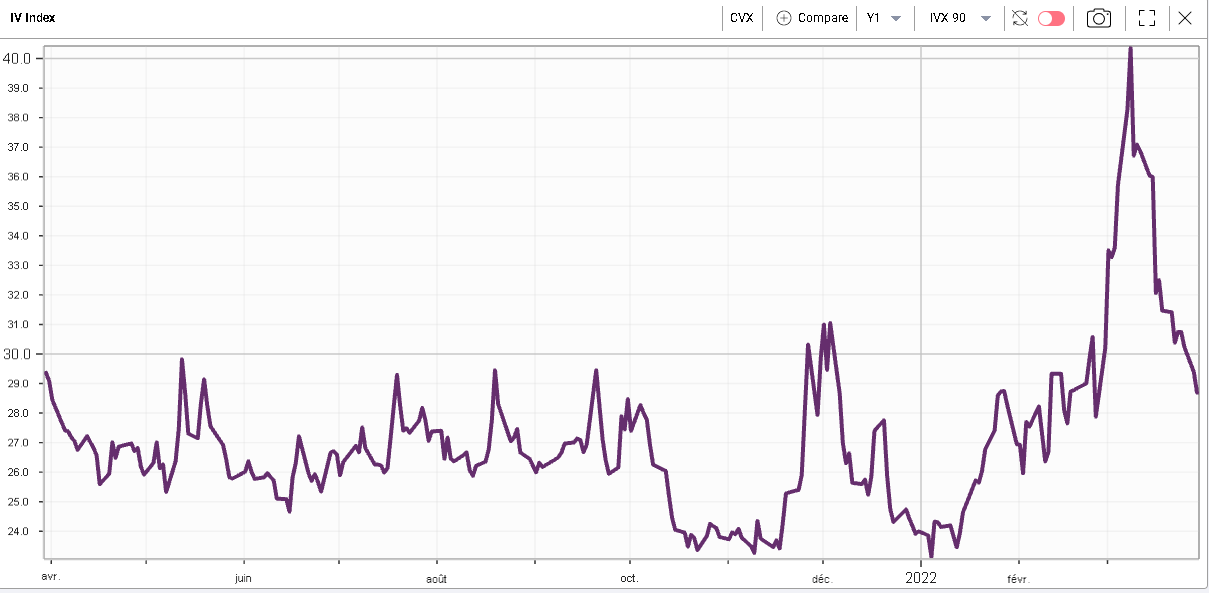
For instance, CVX has an IV that remains very elevated historically despite having substantially corrected from its peak. |
|
Disclaimer - This information is provided for general information and marketing purposes only. The content of the presentation does not constitute investment advice or a recommendation. IVolatility.com and its partners do not guarantee that this information is error free. The data shown in this presentation are not necessarily real time data. IVolatility.com and its partners will not be liable for any loss or damage, including without limitation, any loss of profit, which may arise directly or indirectly from the use or reliance on the information. When trading, you should consider whether you can afford to take the high risk of losing your money. You should not make decisions that are only based on the information provided in this video. Please be aware that information and research based on historical data or performance do not guarantee future performance or results. Past performance is not necessarily indicative of future results, and any person acting on this information does so entirely at their own risk. |


