Markets turn green
July 20, 2022
Very strong bounce in headline indices yesterday with the SPX gaining 2.8%, the DJIA 2.4% and the NDX finishing 3.1% in the green.
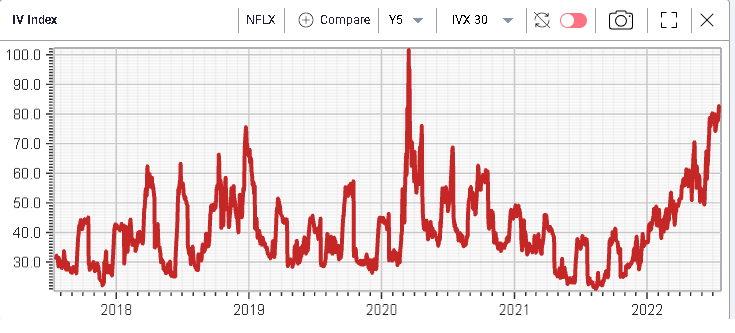
In yesterday’s market update, we discussed the upcoming NFLX earnings report. The stock gained 5.6% on the day and after-hours, the stock was pointing to a further 7.5% gain.
Media reports indicated that the company lost 1 million subscribers over the quarter, half of what was expected across the market.
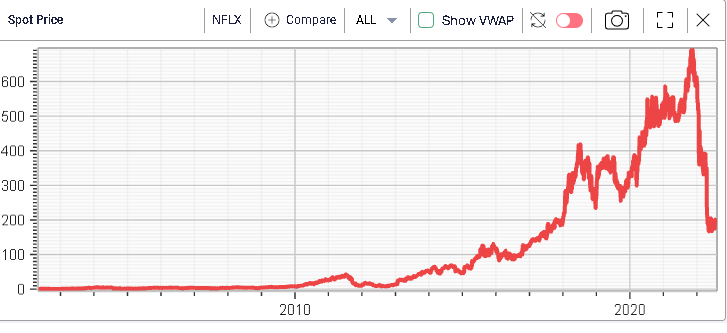
The company stock price shown above highlights the very large drop of value witnessed since the highs of end 2021. The stock has lost around 66% of its value in 2022.
Using the RT Spread Scanner to search for attractive bull vertical spreads in the name, we get the following list of suggestions sorted by Risk/Reward ratio.

The most attractive spread is the Jan’23 220/410 bull vertical spread. The cost of the structure is set at $2,718 and the potential 2 standard deviation profit is $15,608 giving a net 17.5c of risk for each $1 of potential gain.
Over in Europe, the ECB on Thursday will be a highly expected event with the European Central Bank set to raise rates for the first time since 2011. Media reports have indicated over the past few days that the debate between a 0.25% or a 0.5% hike was still raging. As a result, the EURUSD FX pair has moved away form parity for now, trading around 1.025.
The ECB is also set to unveil the characteristics of a new program supposed to ward off fragmentation risk in the Eurozone, in particular in light of raising rates. As political tensions in Italy seem to be increasing once again, traders will be particularly keen to hearing what the ECB has to offer on that front.
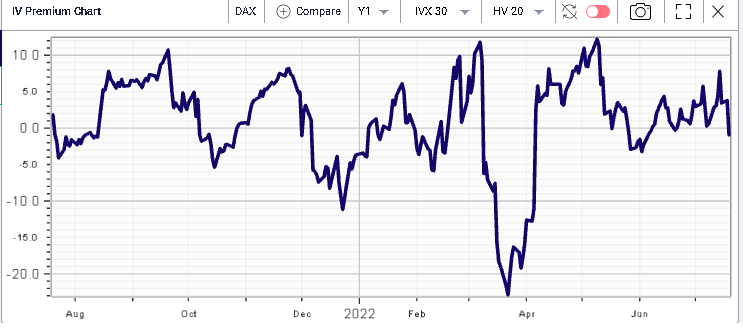
30d IVX for the German DAX has dropped recently but remains around the 25% mark which is pretty much in line with recent realized volatility as displayed on the IV Premium chart below in blue (30d IV vs 20d HV).
Recent media reports indicated that the net overweight position in stocks for fund managers was at its lowest level since October 2008 according to a survey from Bank of America. Raising rates are cited as being the main culprits here with worries around the future earnings of American corporations.
This is the reason why the current earnings season is particularly important and will be watched closely. Bulls will search for signs that US companies remain confident and resilient in the face of the economic pressure they face while bears expect confirmation signals that the management of companies is getting more worried about their economic prospects.
When it comes to earnings, not all names are equal and traders pick the ones where they think owning options is most attractive.
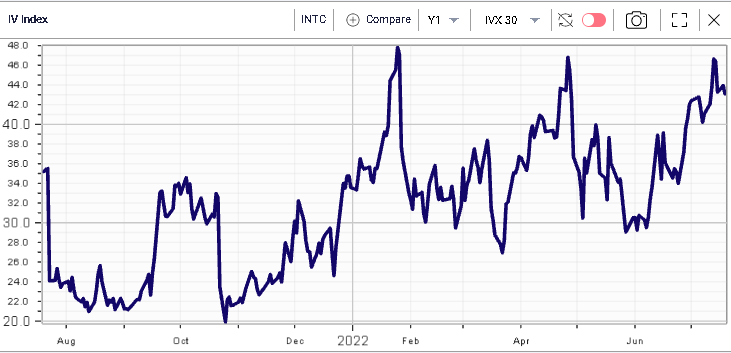
For instance, in INTC, the 30d IVX has been going higher over the past few weeks as the earnings on the 28th July gets closer.
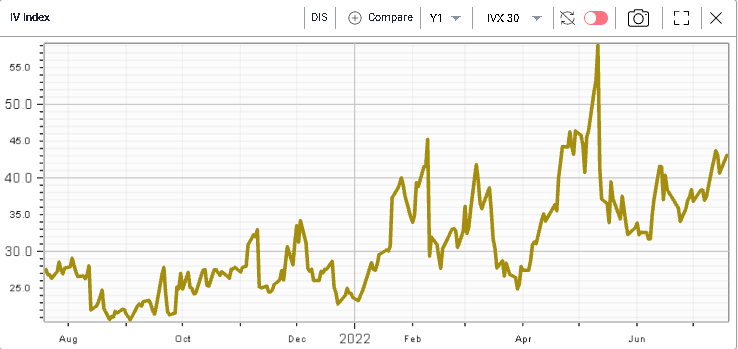
For DIS which is due to report on the 10th Aug’22, implied volatility has started to move higher although the demand has not pushed IV to extreme levels yet.
