Market News & Research - Expecting Capitulation
July 25, 2022
Before getting started, thanks to a comment from an astute reader, the Summing Up section in last week's Yield Curve Inversion needs correcting as follows. Bond buyers responded to the CPI report by selling the short end of the curve while buying the long creating an unmistakable yield curve inversion and signaling increasing recession odds.
With a seemingly endless stream of economic and market news and opinions coming from almost every source, can capitulation occur when the consensus expects it? Perhaps not. This well-known adage answers the question. "If it's in the press, it's in the price."
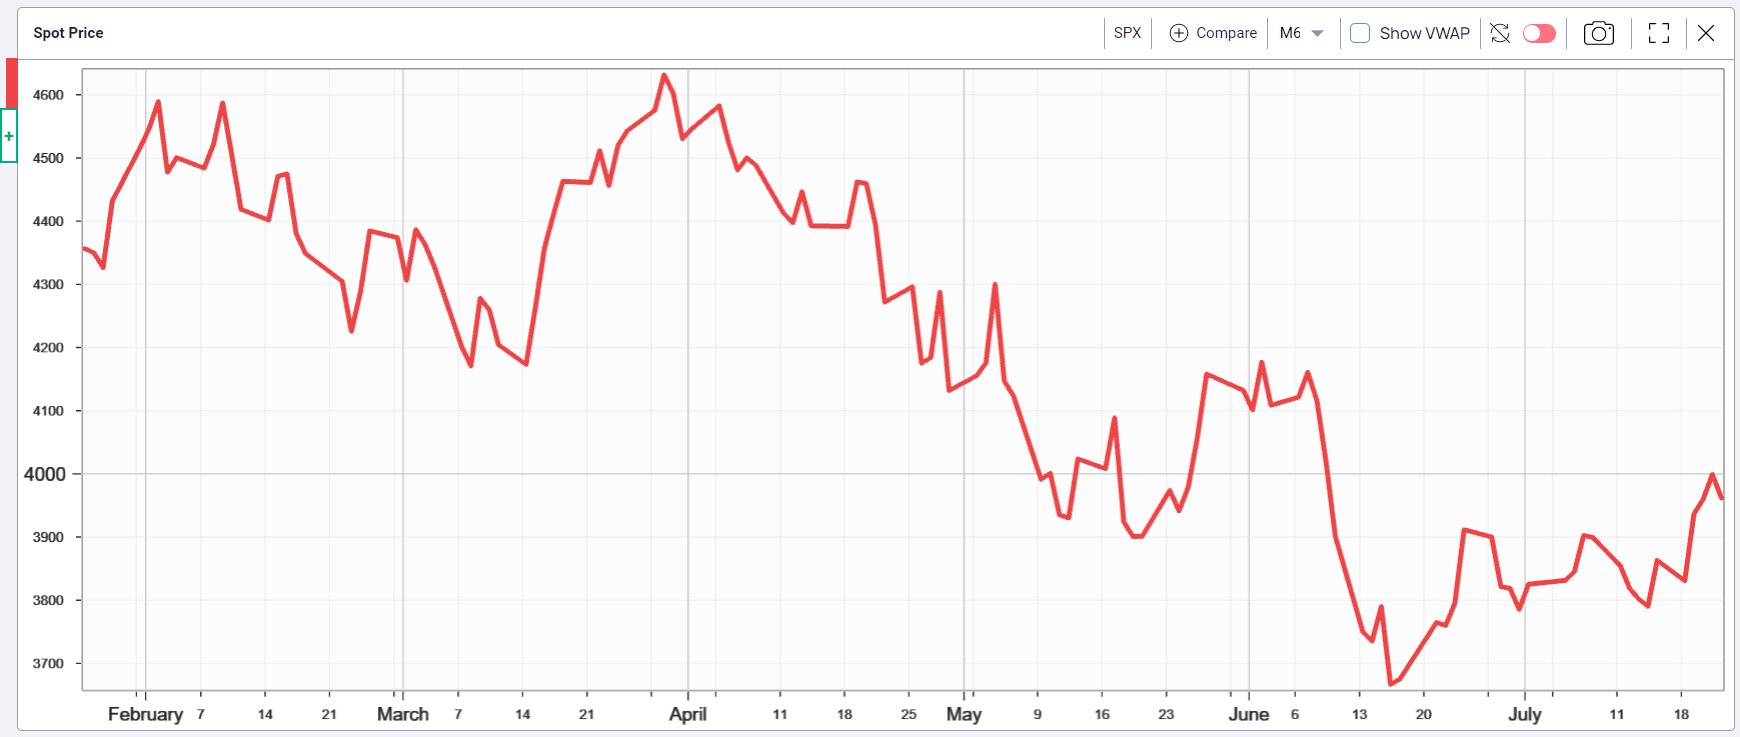
S&P 500 Index (SPX) 3961.63 gained 98.47 points or +2.55% last week with most of the gain occurring on Tuesday with a 105.84 point gain and closing above the 50-day Moving Average activating a small double bottom technical pattern from the July 5 and July 14 lows with an upside measuring objective at 4105. The still open gap at 4017.17 made June 10 on the way down, represents the next challenge and a good way to measure the strength of this current bounce.
A potential Head & Shoulders Bottom pattern could develop from the low made July 14 at 3721.56 that could become a right shoulder although deteriorating fundamentals along with analyst's downgrades suggest the June 17 low at 3636.87 may not mark the bear market bottom. On the other hand, how far down into the tank can it submerge without the homebuilders since they bottomed on June 17? In addition, the NYSE common stock only Advance-Decline Ratio ended at -957.92 on June 13, the lowest level in the last year. More bottoming evidence comes from the fixed income markets below.
This week many widely followed big cap stocks report earnings along with the big cap energy. It's an open question if capitulation can occur when the consensus expects it since more and more evidence shows signs of bottoming activity between June 13 and June 16.
What to do if anything. If risk can be defined as paying prices that are too high then it's hard to get badly hurt when falling out of a basement window.
The SPX chart.

U.S. 10-Year Treasury Note
Last week the yield on the U.S. 10-Year Treasury Note declined 16 bps with 27 bps lower Thursday and Friday to end at 2.77%. Some bond market analysts say the June 14 high at 3.49% will likely mark the high for this cycle while Fed Funds may reach 3% or 3.25% before the Fed pulls back. If so, expect a long period of inversion for 10-2 yield curve
10-2 Yield Curve
Sustained inverted yield curves when the yield on the 2-Year Treasury Notes exceed yield on the 10-Year Notes precede recessions by several months or in some cases like January 2006, almost two years or June 1998, just under three years. According to a Federal Reserve Bank of San Francisco publication, inverted yield curves warned of all coming economic recessions in the past 60 years, except for one.
Wednesday July 13, the yield on the 2-Year Note gained 10 basis points (bps) while the 10-Year yield declined 5 bps ending with a 22 basis point inversion. Friday the inversion narrowed slightly at 21 bps compared to July 13.
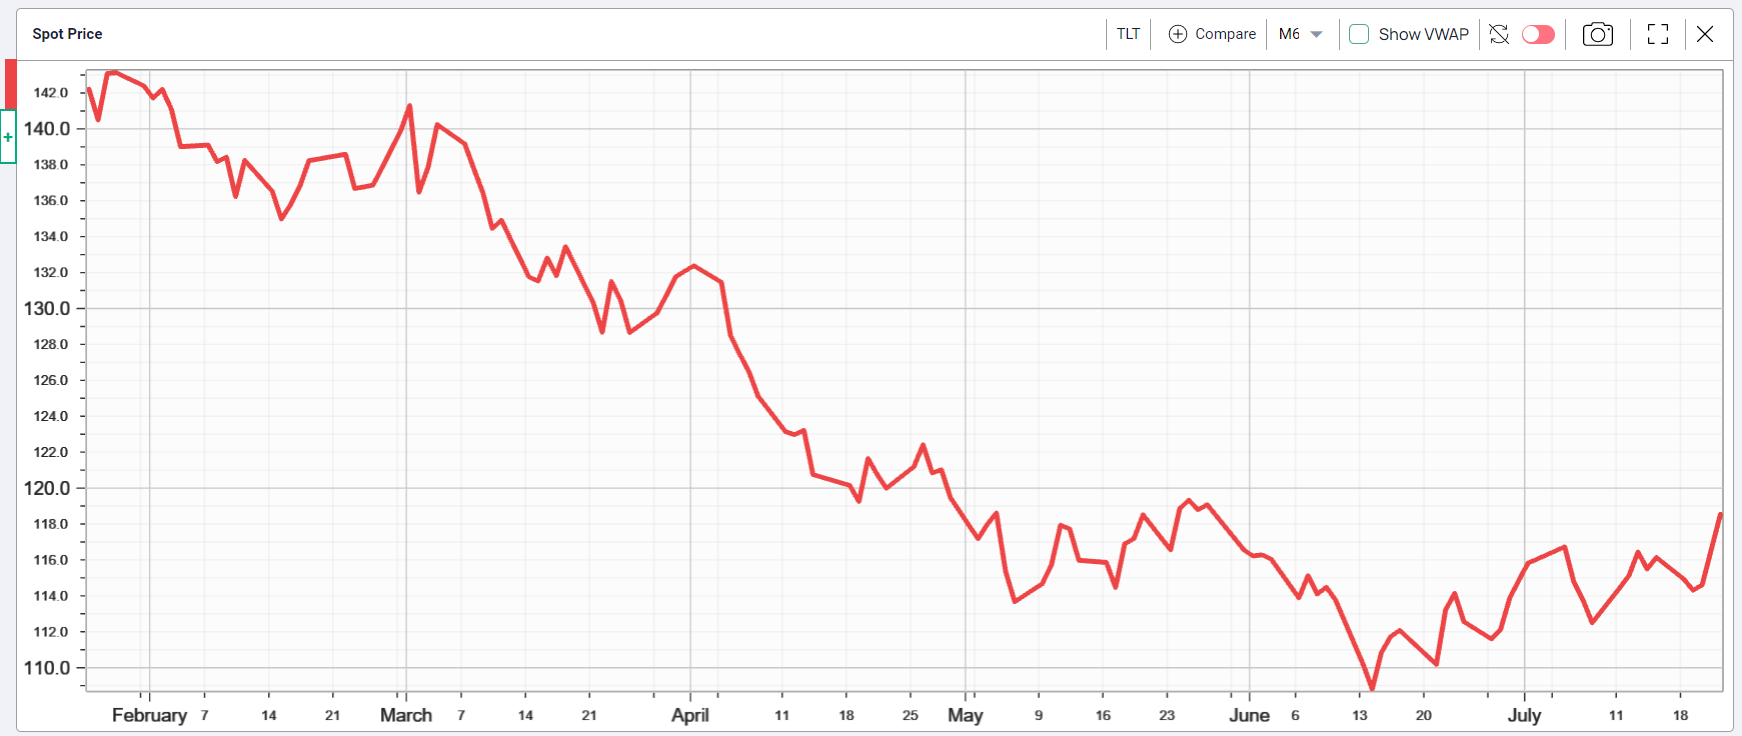
iShares 20+ Year Treasury Bond ETF (TLT) 118.55 added 2.41 points or +2.08% last week closing above the downward sloping trendline from the March 1, 2022 intraday high at 141.34, and back above the 50-day Moving Average at 114.78. Friday's gap up open that ended 1.96 points higher on the day reflects a rush into long dated bonds anticipating future declining rates. For the week, the yield declined 11 bps from 3.34% to 3.23%.

Implied Volatility
SPX options implied volatility index IVX declined 1.82% to 20.29% from 22.11% on July 15. Last week SPX options activity lacked any noticeable signs of hedging activity going into this week with many widely followed big cap stocks reporting. Perhaps current prices already reflect downgrades.

Summing Up
Paying less attention to media reporting accompanied with a lot of doomsday chatter but more on the messages from the markets suggests potential bottoms occurred in both equity and fixed income between June 13 and June 16. That could all change this week if one or more of the widely followed big caps report earnings below already lowered expectations followed by disappointing guidance.