Market News & Research - Resistance Prevails
August 22, 2022
After a remarkable run- up from the right shoulder of a Head & Shoulders Bottom pattern shown last week, it appears this leg of the advance ended Friday as several closely followed indicators flashed caution signals, including market breadth after the S&P 500 Index stalled just under the 200- day Moving Average. Both the equity and fixed income markets suddenly no longer want to challenge the Fed before Jay Powell speaks at Jackson Hole on Friday morning. Selected indictors reflecting the changed sentiment follow.
S&P 500 Index (SPX) 4228.48 declined 51.67 points or -1.21% with the most noticeable 55.26-point loss occurring on Friday. The indicators:
Tuesday resistance at the 200-day Moving Average then 4326.18 held as it turned SPX back after reaching 4325.28.
Thursday the volume weighted VIX futures premium ended at 21.00%. Higher levels for new front month premiums are normal. However, previously levels around 20% preceded pullbacks. Friday it ended at 20.56%.
Friday monthly options expiration: "$975 billion of S&P 500-linked contracts and $430 billion linked to individual stocks," were due to expire according to Bloomberg. Market makers have an incentive to reduce their risk from in-the-money options, especially call options, by pushing stocks and ETFs lower after the long market advance. Thin August trading volume likely made this effort easier.
Friday SPX closed below the upward sloping trendline, USTL from the July 14 low at 3721.56 that formed the right shoulder of the Head & Shoulder Bottom pattern.
10-Year U.S. Treasury Note yield gained 14 basis points to end at 2.98%. In addition, the U.S. Dollar Index pushed higher to 108.10 after making a pivot on August 11 at 104.52. Both suggest less enthusiasm for fighting the Fed before Friday's comments from Jackson Hole.
Market Breadth as measured by our preferred gauge, the NYSE ratio adjusted Summation Index that considers the number of issues traded, and reported by McClellan Financial Publications gained another 101.51 points last week ending at 830.17 after slipping Friday 29.52 points recording the first loss since the July 14 pivot at -411.66. Should Thursday's high at 859.79 hold the total gain since July 14 works out to an astonishing 1,271.45 points. While it's too soon to tell if Thursday's high becomes an important top or just a pause until after Jay Powell's comments on Friday.
Implied Volatility
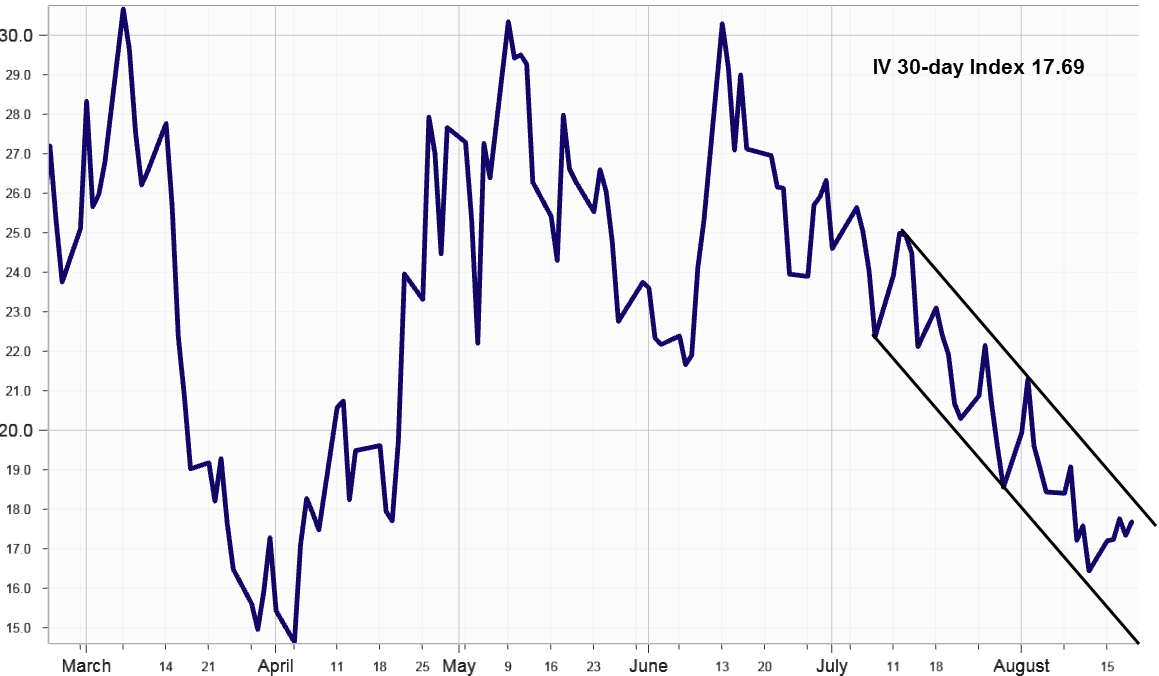
SPX options implied volatility index, IVX turned up 1.25% last week to 17.69% from 16.44% on August 12. It's still in a well-defined downward channel, but now heading up toward the upper band. While implied volatility under 20% remains positive, influence from last Friday's monthly expiration, still played a role. Put this one in the wait and see bucket along with the others.

Summing Up
After the S&P 500 Index failed to advance above the 200-day Moving Average last Tuesday, the markets quickly turned more cautious. Friday concluded with warning signals appearing from many important indicators including market breadth, but not option premium. While too soon to abandon the upside measuring objective from Head & Shoulder Bottom at 4563, it does suggest the markets decided to give the Federal Reserve a bit more respect at least until Friday's comments from Jay Powell.