China crashes, US moves higher, Volatility is unchanged
October 25, 2022
US markets continued to push higher yesterday despite some selling pressure around the open. The SPX settled 1.2% higher, the NDX 1.06% higher and the DJIA 1.34%.
The main event yesterday was once again found in China with the HSCEI losing almost 8% over the session. We had highlighted the significant underperformance of the Chinese index over the past weeks in a prior market update and things have continued to escalate on that front.
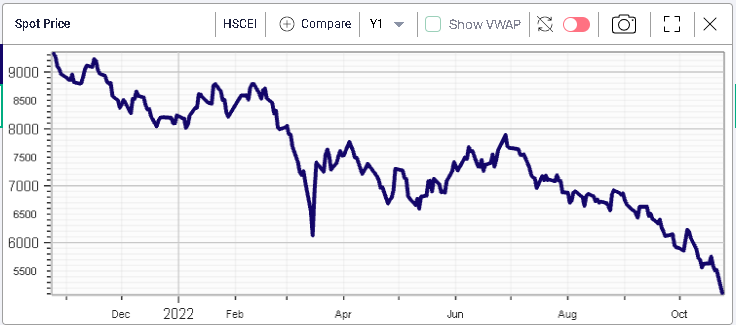
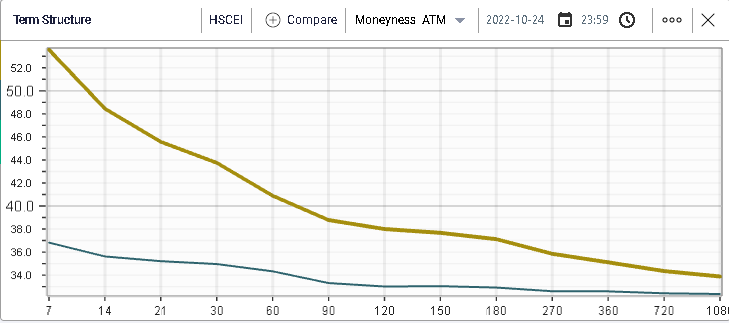
Over the year, the HSCEI is now around 37% lower and with yesterday’s price action, we saw implied volatility jump by around 10 points for the HSCEI as shown below.
US markets seemed driven by more defensive stocks yesterday with the two best performing sectors being the healthcare and the consumer staples segments which are respectively -7.5% and -9% YTD while the more speculative parts of the market seemed to struggle, for instance with consumer discretionary stock up around 0.5% or energy stocks up 0.6%.
Looking at implied volatility for the SPX below, we can see that IV moved higher by around 0.5 points over the session despite the market moving higher.
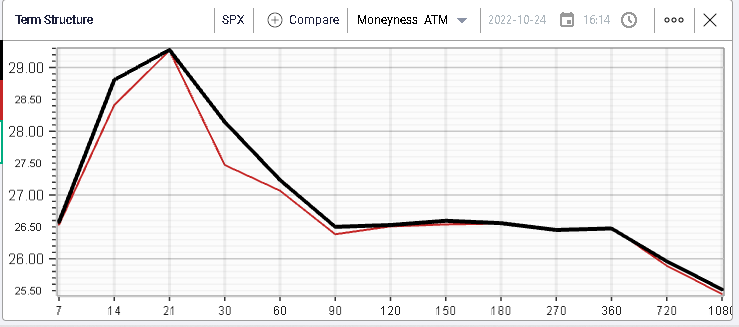
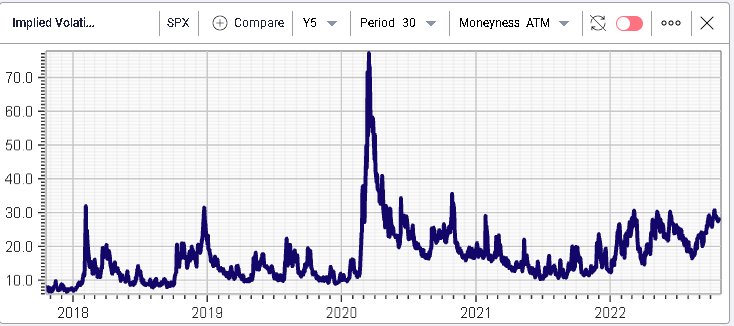
Looking at the IVX30 for the SPX over the past 5 years, we can see the options market makers have kept implied volatility close to the 30% mark despite the rally in spot back above 3800.
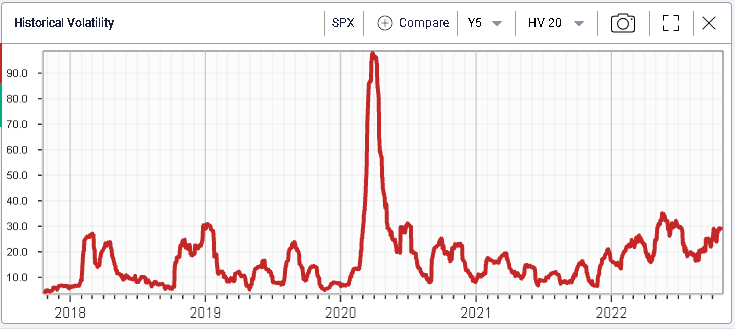
This is pretty much in line with the historical volatility seen over the last 20 days as shown below.
