Position squaring ahead of midterm elections
November 8, 2022
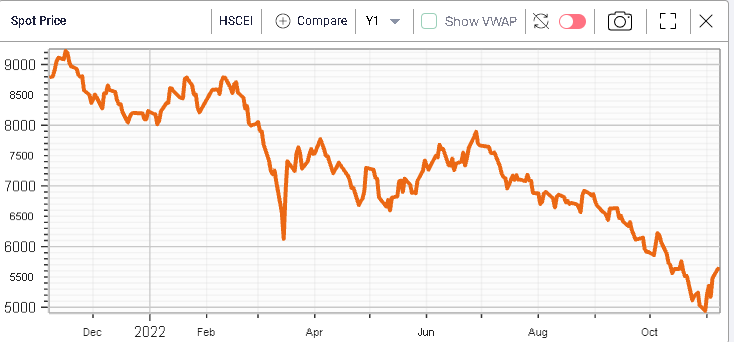
Chinese equity indices outperformed on Monday following last week’s very strong performance.
The HSCEI finished higher by around 2.8% and has now gained more than 14% from its recent lows in October 2022.
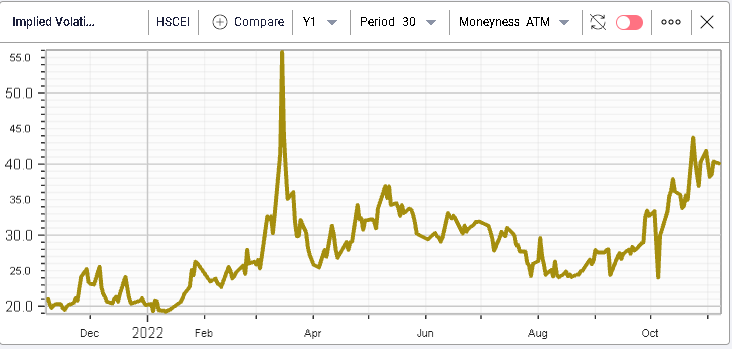
Implied volatilities in the index have remained very firm as shown on the below chart with the 30d ATM implied volatility remaining around 40%.
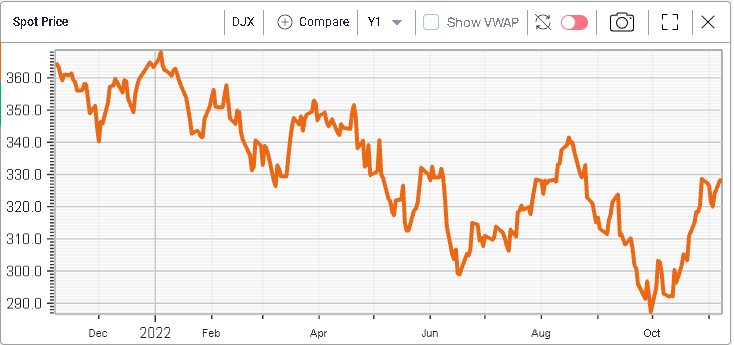
The DJIA also had a good performance on Monday gaining 1.3%.
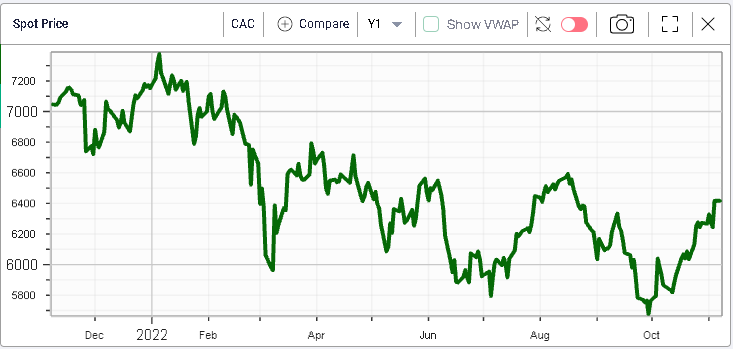
On the other hand, European assets trailed with the German DAX gaining around 0.5% and the French CAC finishing unchanged over the day.
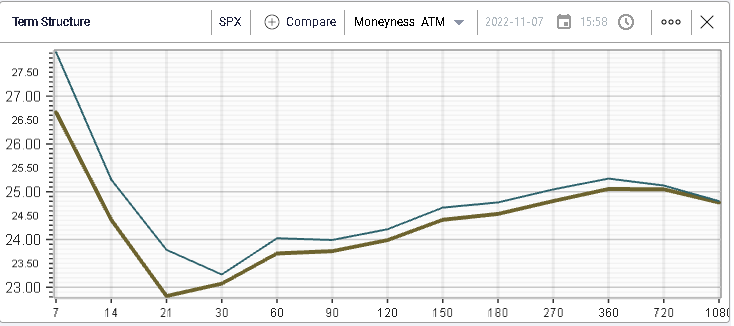
Looking at implied volatilities, they deflated over the session with 30d IVX for the SPX losing around 0.2%. Short dated options remain very elevated with 7d IVX for the SPX around 26.5%.
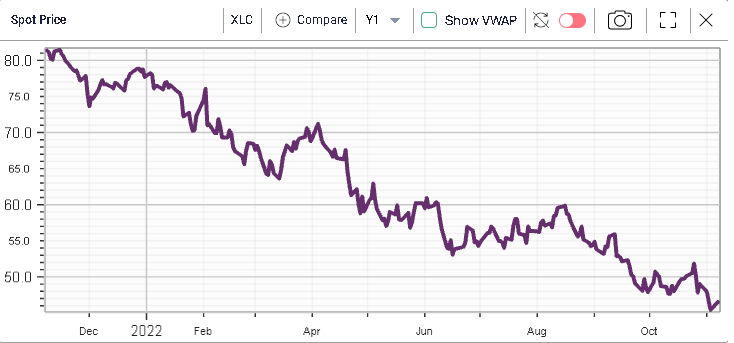
Looking at sectors, the Communications space was the best performing sector over the day gaining 1.8% but is still around 40.5% lower on the year as shown below.
The Energy segment also continued its very strong performance making new 12 months highs and gaining 62.5% in 2022 alone.

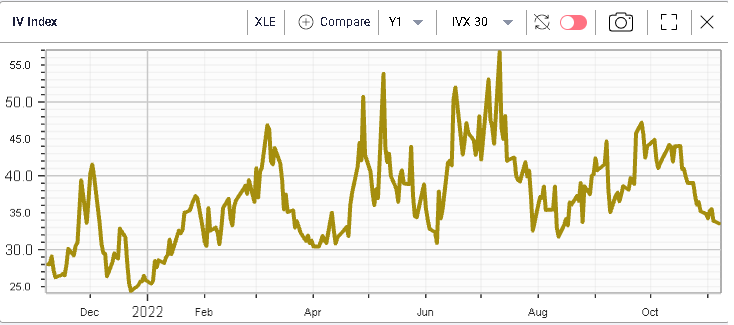
The implied volatility around the Energy sector has also dropped significantly over the past few weeks as seen below with the 30d IVX now trading around 33.5%.
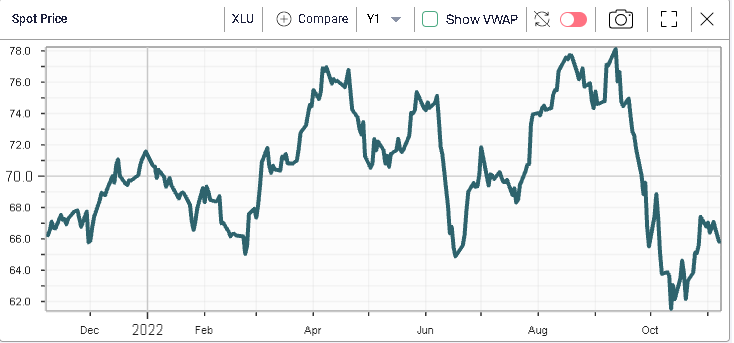
On the downside, we saw Utilities underperform and lose around 1.9%. The sector is down around 7% on the year and the implied volatility seems to indicate that options market makers remain slightly concerned about the space with 30d IVX a little higher than its 12 months average.

Consumer discretionary stocks also failed to participate in the rally and lost 0.7% over the day (-35% YTD).
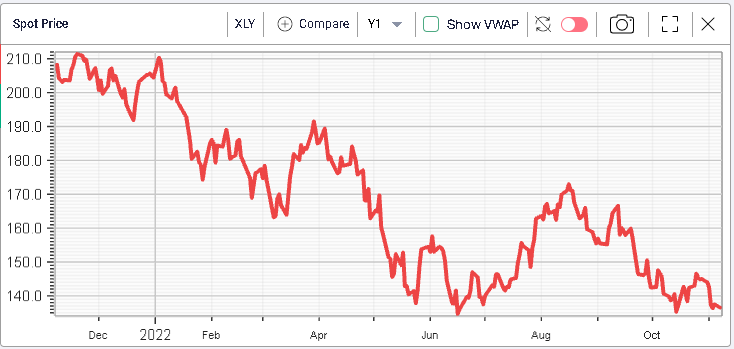
All in all, it felt like investors were trading around their existing positions with little moves of significance either at the index level or at the sector level. Traders most likely remain focused on US midterm election due on Tuesday.