Let's look at crypto ETFs and options
November 22, 2022
Following a meteoric rise between late 2020 and late 2021, crypto assets have reversed course throughout most of 2022 and are now back at their levels of November 2020. The below chart shows the last 3 years of price action in BTCUSD.
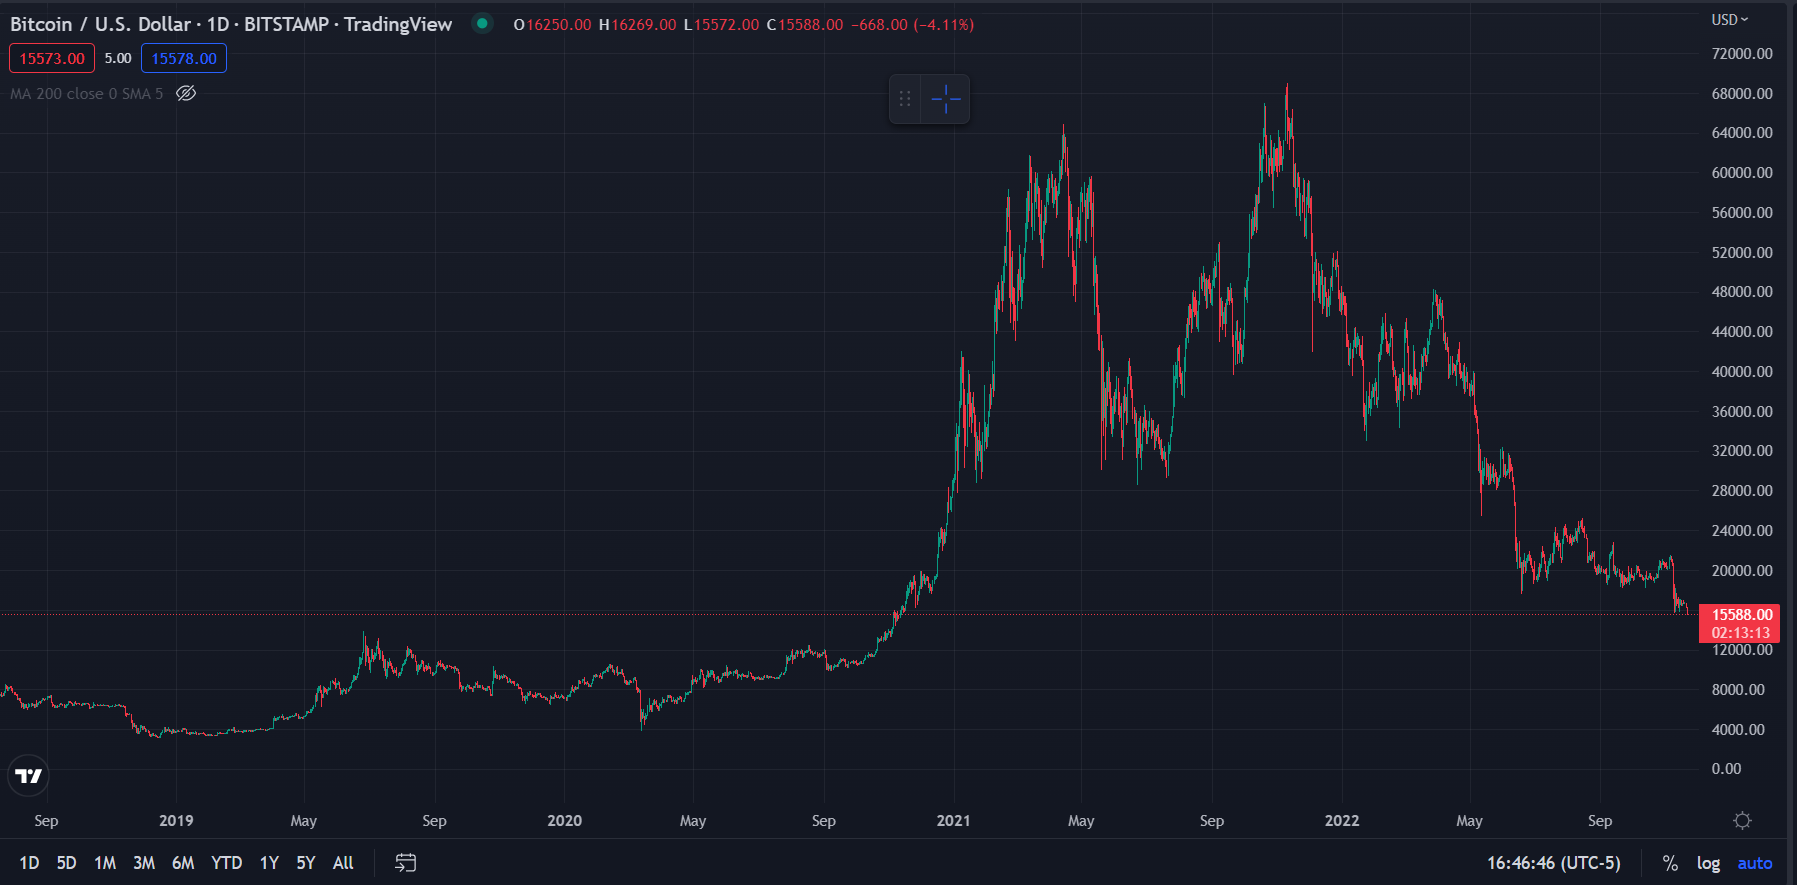
Source: Tradingview.com
In October 2021, pretty much at the all-time highs of BTCUSD, the BITO ETF was launched. It has now lost around 76% of its value since inception.
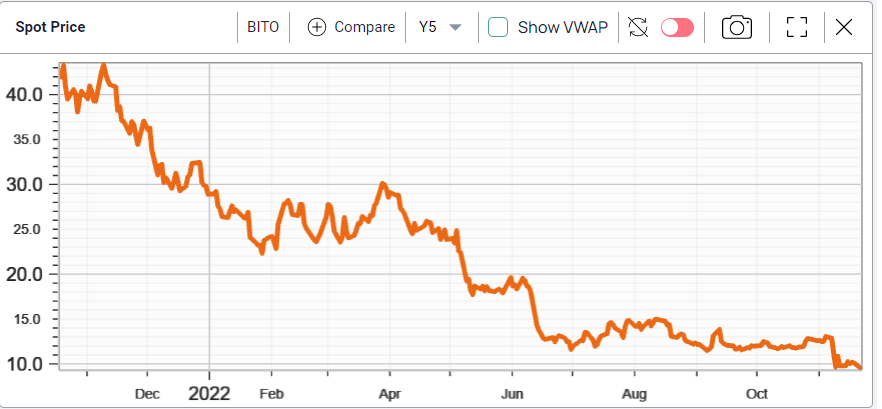
For traditional investors, BITO offered a way to get a direct exposure to Bitcoin. It quickly gained in popularity and saw options being added as a derivative, allowing traders to not only get a direct exposure to Bitcoin but also a leveraged one via options.
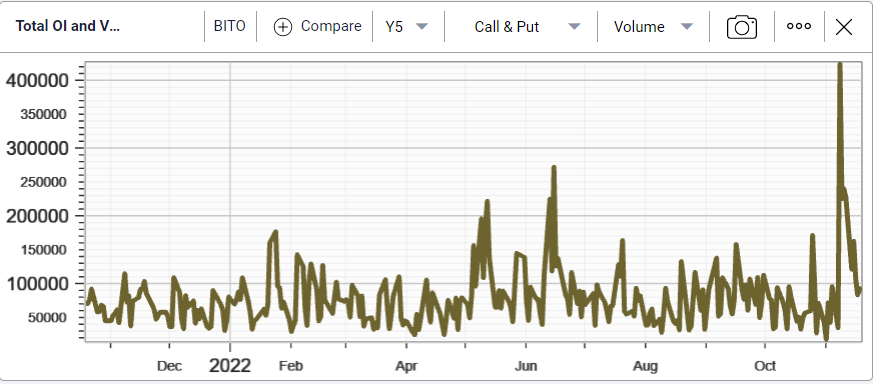
Volumes in BITO options were relatively steady around 100k until recently when they started to make significant new daily highs with total call and put volumes reaching above 400k options.
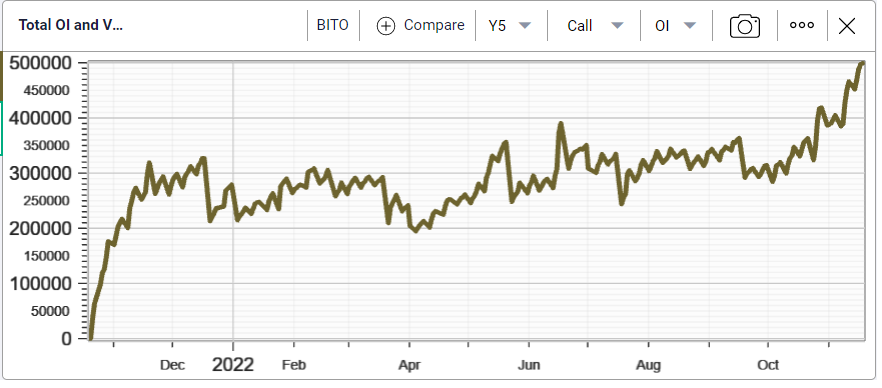
Looking at outstanding positions, we see below 5 years of history of BITO call open interest reaching new highs around 500k.
The same growth has been visible on the put side with around 600k outstanding put options on BITO at time of writing.
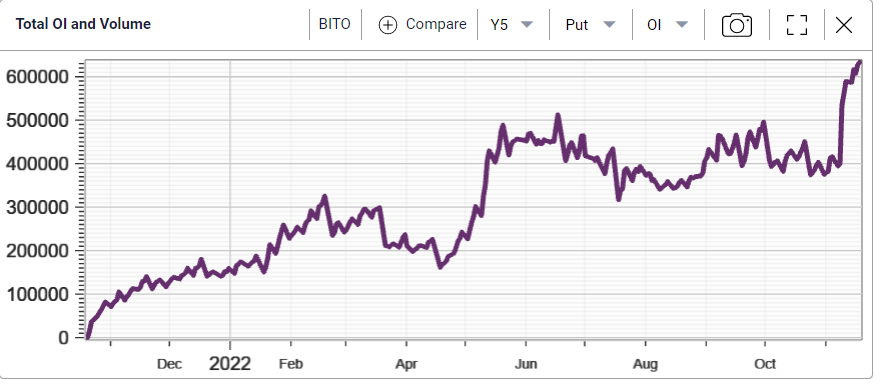
This is an important observation. As many market commentators are now claiming that crypto assets are of interest to almost nobody, the underlying options data seem to indicative otherwise.
Looking at the 30d IVX on BITO shows how, as the FTX story was unfolding, options market makers reacted by pushing implied volatility significantly higher in BITO.
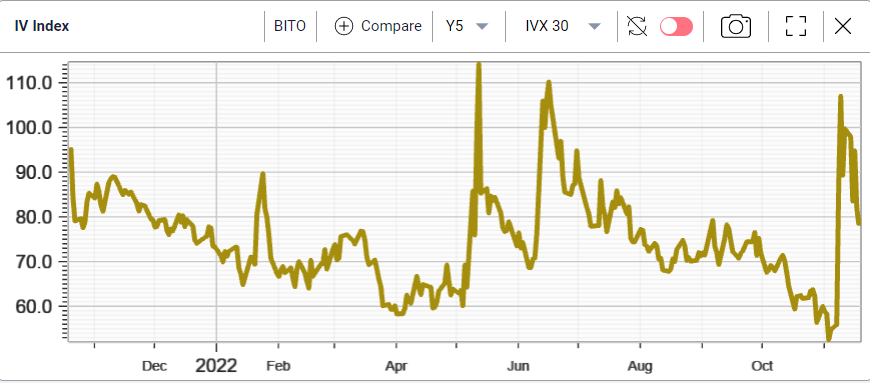
Implied volatilities have since then deflated despite realized volatilities staying relatively elevated, a possible sign that options market makers are now anticipating things to quiet down on the crypto asset front.
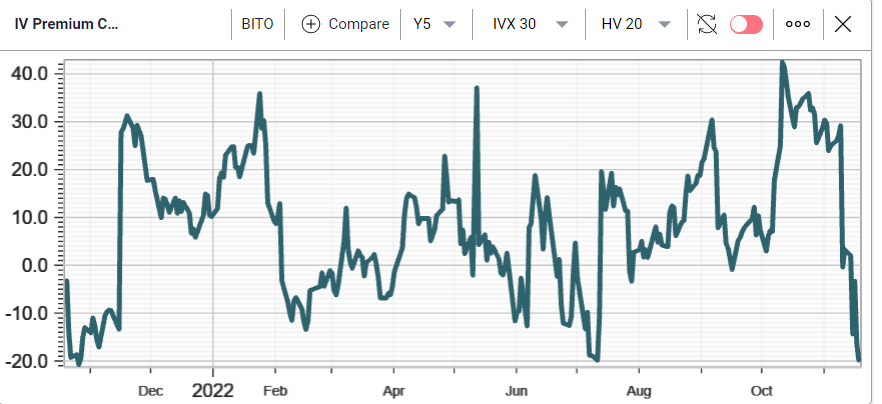
Below, we look at the traditional 30d/20d IV Premium chart, comparing the 30d IVX with the 20d HV. We can see that implied volatility in BITO is trading at its largest discount to realized volatility since the start of BITO options.
In order to appreciate how much things have moved from an implied volatility perspective; we leverage the information from the term structure chart shown below.
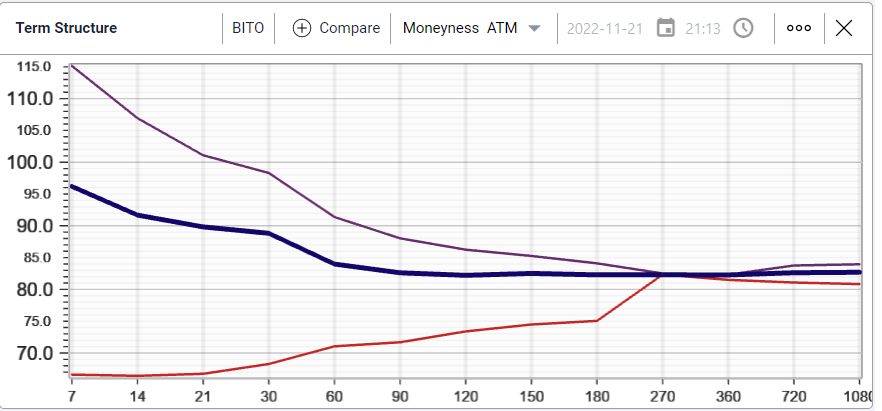
We see in purple implied volatility as of the 11th Nov’22 when FTX declared bankruptcy. The red term structure was snapped in early October while the blue TS was taken on the 21st Nov’22.
First, we can see that options for first 6 months repriced higher by most as the FTX story was playing out. Second, the very short dated implied volatilities (for instance 7 days) went from 65% to 115% and is now back to 95%. In other words, we have retraced around 40% of the move higher as things seemed to have settled down.
The crypto market remains very nervous but some of the immediate pressure seems to have slightly vanished for now. It will be interesting to keep watching that space for clues as to what might happen next.