Last Week’s Highlights at IVolLive:
- Don't forget to register for our next live webinar on Thursday, September 21th 2023 Webinar Topic: Harness the Stock Monitor to Run and Create Custom Scans to Create a List of Actionable Trades. HERE
- Get a free IVolLive Trial HERE.
Let's Talk Oil...
September 15, 2023

Despite rising interest rates and costs, based on the latest August retail spending report, consumers are still alive and well, with retail spending increasing 0.6% overall, slightly ahead of July's 0.5% print.
That said, the number one impediment to letting the good times roll as we head into fall is surging gas prices, with gas prices hovering at their highest level in 10 months (the national average for a regular gallon of gas now stands at $3.86).
But of course, markets are dynamic… one person's pain is another's gain. And in this case, this dovetails well with a trend we've been following closely in these issues: the rising price of oil/gas and the resurgence in energy names.
After all, as the products they sell generate more income, this in turn leads to higher revenues and ultimately, profits.
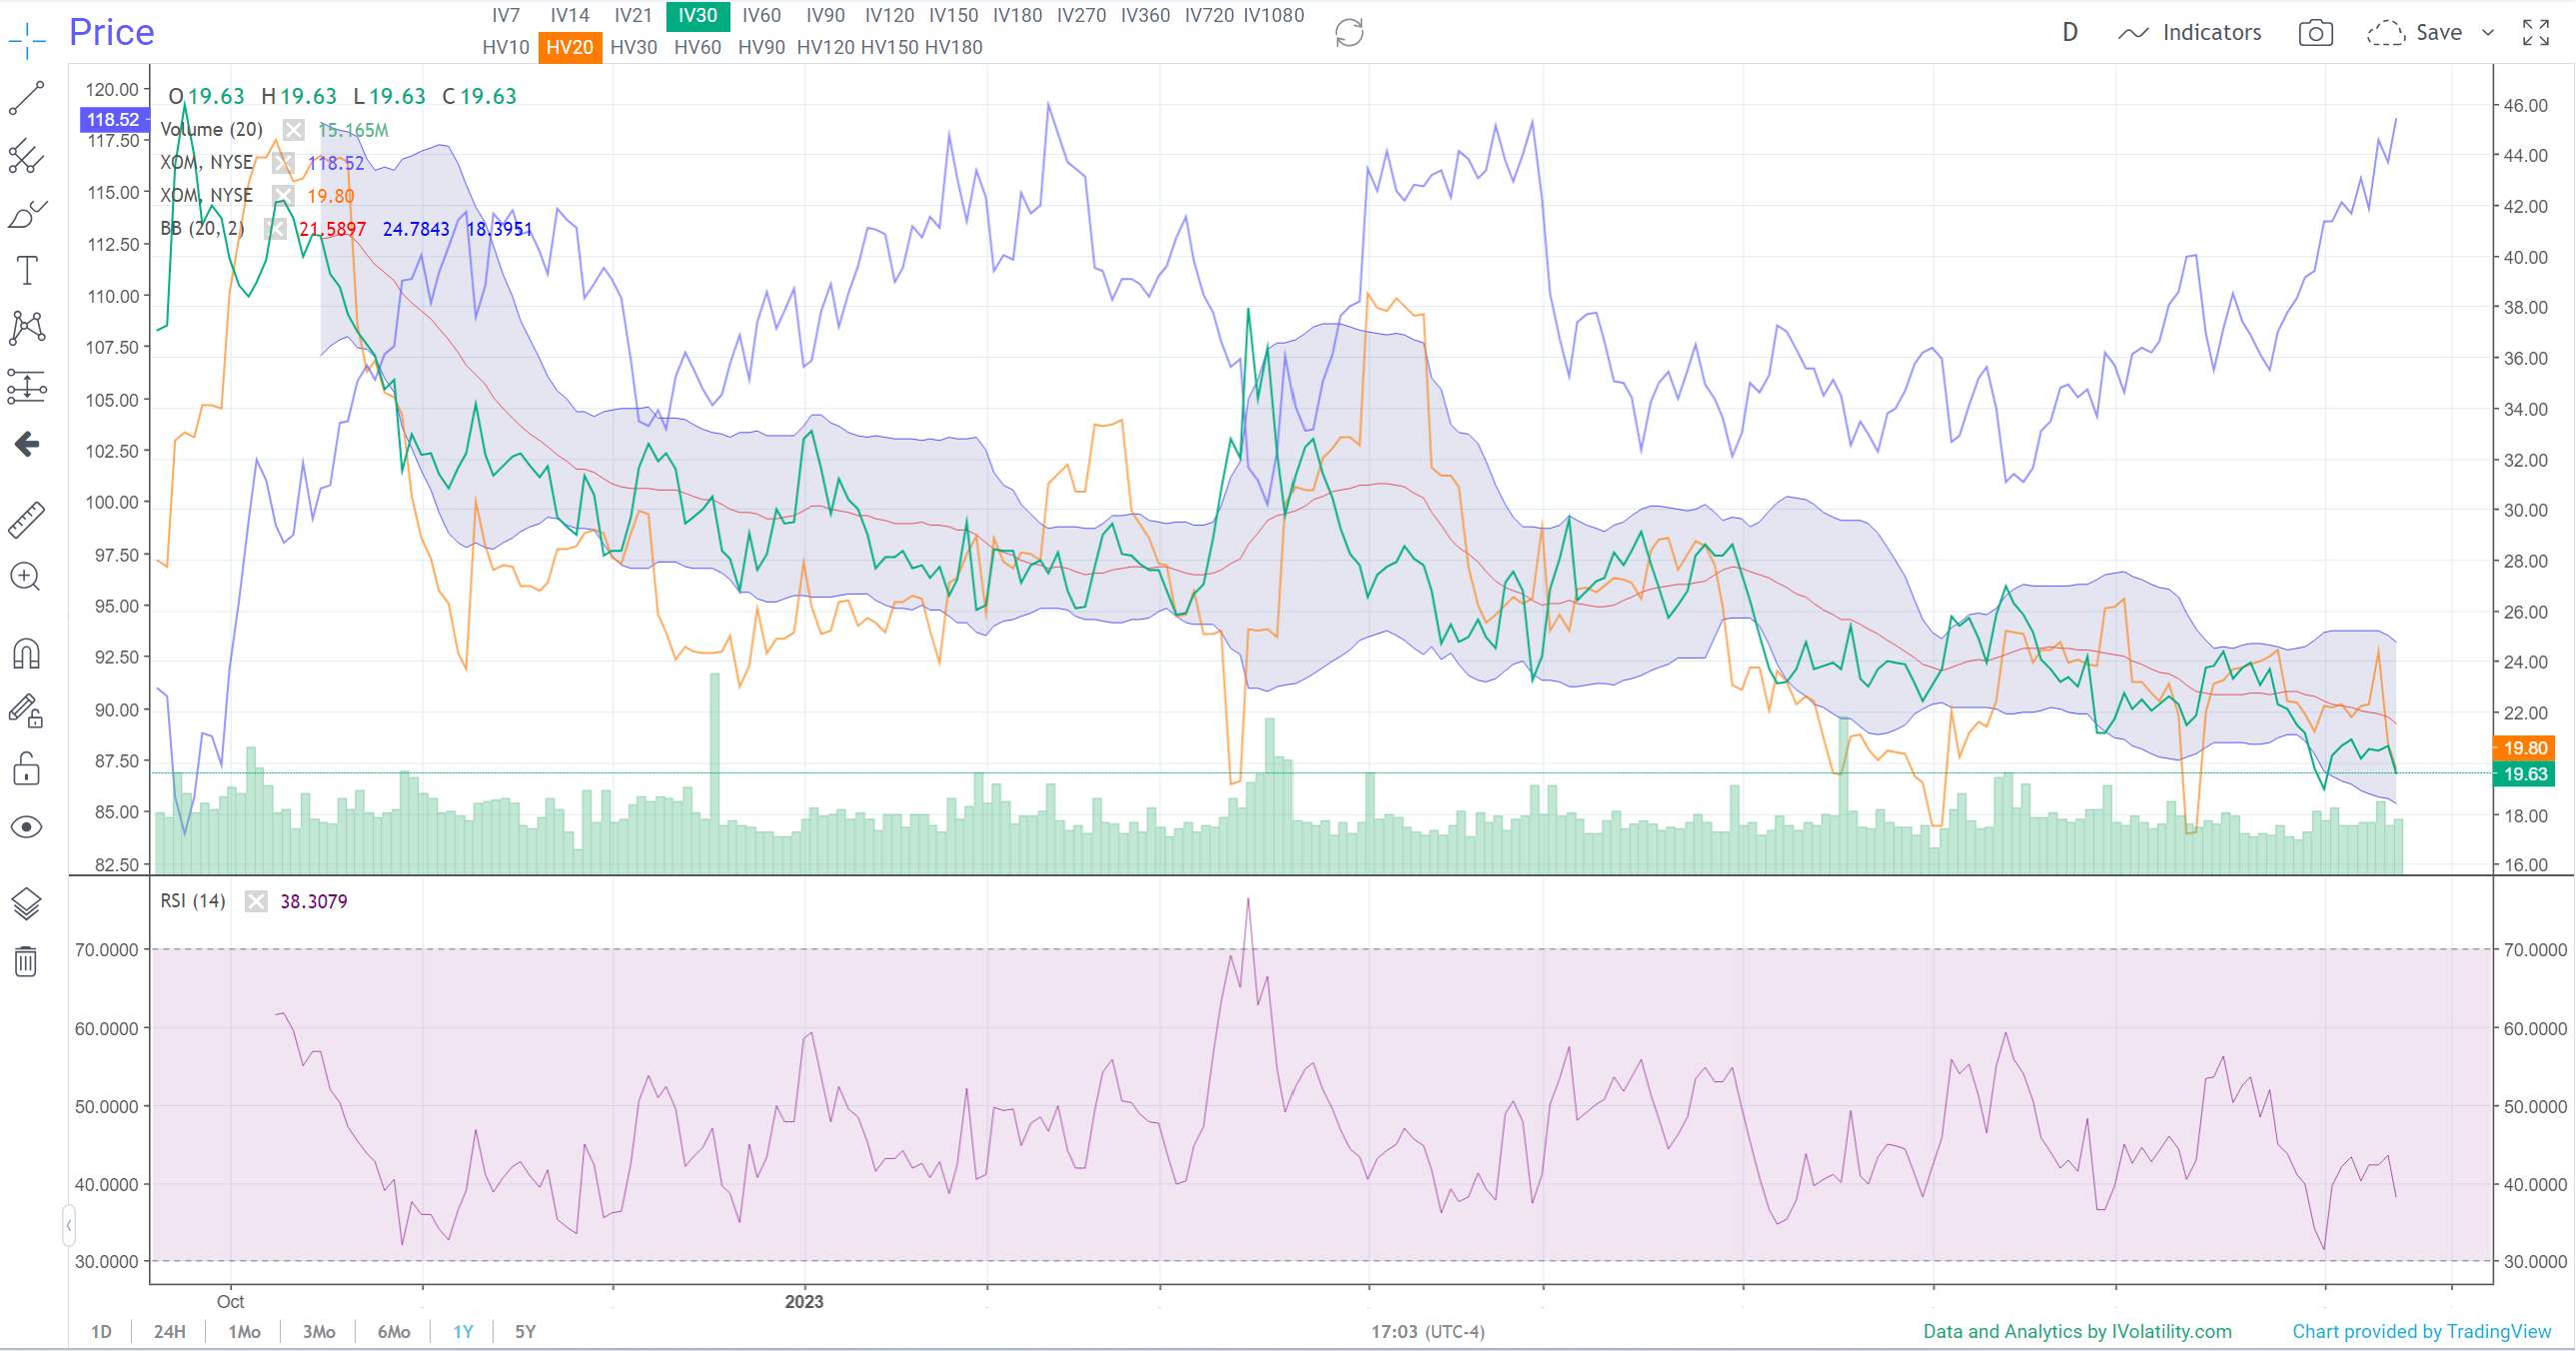
From there, it's only a matter of time before this shows up in the stock price. For proof, check out this one-year chart of energy giant Exxon (XOM):

We've overlaid some technical indicators that we'll get to in a moment. But for now, notice Exxon's price (the blue line) which has been marching steadily higher throughout the summer and into the fall. We've now taken out and made fresh 52-week highs...
How to Play It
At the same time, its Implied Volatility (the green line) has been moving lower. For anyone bullish on Exxon, this is good as it means option prices are subdued - so it is cheap to buy call options on a rising stock.
Now, IV is near the lower range of its Implied Volatility and RSI ranges. This means it could see a bounce/rise in the coming weeks. This often translates to a downdraft in the stock.
The thing is, implied volatility is coming off very depressed levels. So even if we see a spike, option prices should remain relatively subdued - making now an excellent time to evaluate a bullish trade on energy giants like Exxon.
Previous issues are located under the News tab on our website.