High Volatility And An ETF To Play It
January 16, 2025
The Markets at a Glance


Wednesday was a powerful up day in the market, apparently kicked off by relatively benign inflation numbers. SPY was up 1.82%, QQQ was up 2.3%, and IWM was up 1.97%. Interestingly, RSP was only up .96%, indicating that a disproportionate amount of the advance was in the larger caps and tech favorites in the other three indexes. Historically speaking, moves of this magnitude on the upside occur only once a year or so.
My guess is that contributing factors included pent-up demand from a belated Santa Claus rally and January effect, huge buying from end-of-year bonus and 401k contributions, and probably some short covering.
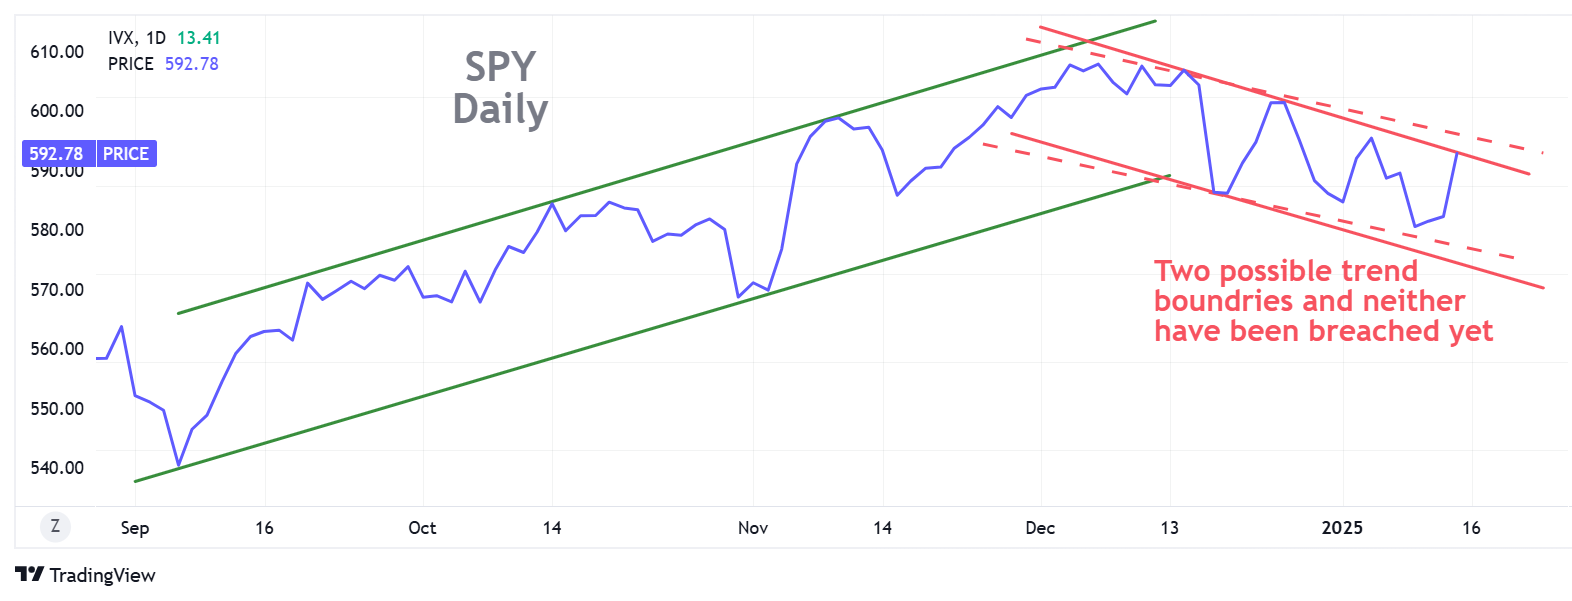
So, where does that leave us? The correction in SPY from the early December top to Tuesday's bottom was -4.6%. That's light as corrections go and yesterday's strong upward move could support a break upward very soon. I will be more convinced of that when the SPY actually breaks through the current down channel (I drew two possible channels on the SPY chart).
Yesterday's inflation numbers do not seem to me to support a big new move upward from here. There is still considerable concern about Trump's policies being inflationary and he hasn't even taken office yet. The Fed has already taken additional rate cuts off the table for the foreseeable future because it remains concerned about inflation rising again under Trump.
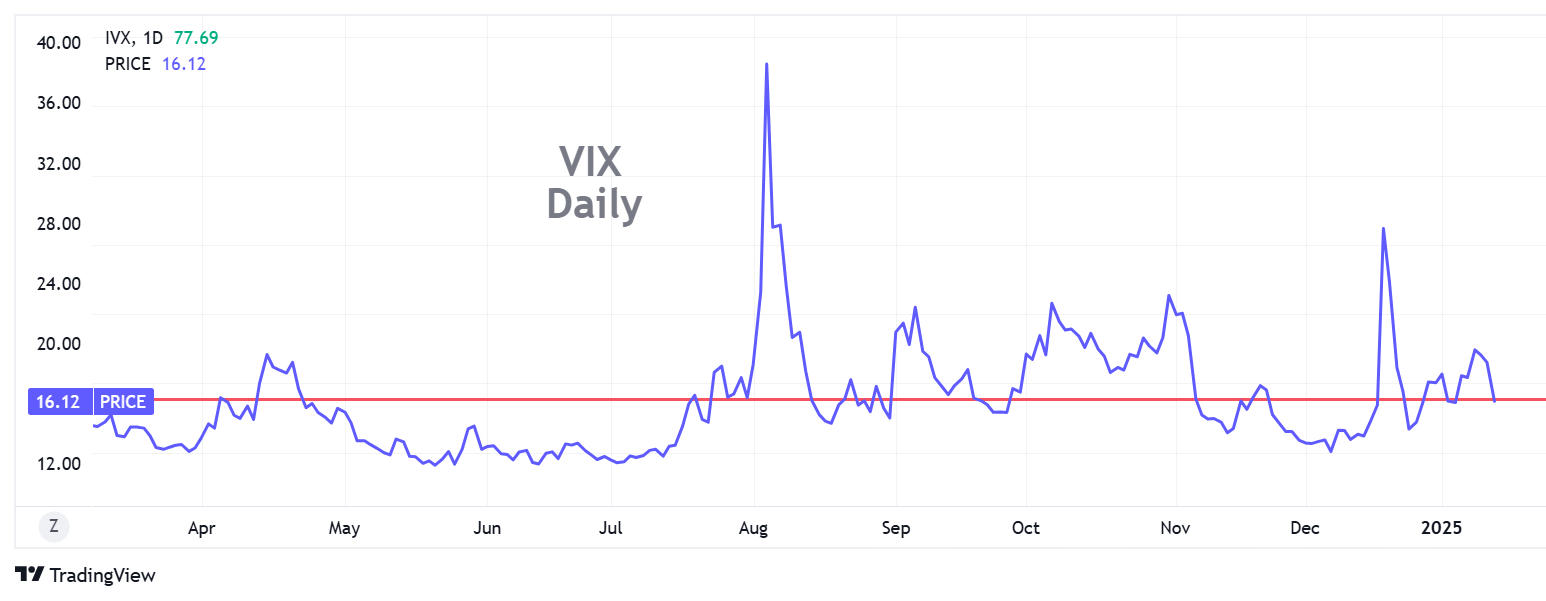
In addition, Trump and his cabinet are full of wild cards. So, while he promises to be positive for business, he is likely to also remain unpredictable, which will continue to feed volatility. Since mid-December, the equity market has had six strong moves (3 in each direction), bringing a see-saw look to the charts with a downward bias. VIX had accordingly run up to 20.65 just a few days ago, falling back to 16.12 yesterday. Since the big spike to 42 last August, VIX has remained notably higher than last year, experiencing 6 smaller peaks in the 20s, whereas for the nine months preceding August, there wasn't a single peak above 20.
If we can break the December-January downtrend line (and we are close), then this run may continue. But I'll reserve that judgment for now. I do like a number of individual charts here, especially in stocks that are recovering from the election sell-off.
Strategy Talk: The Simplify Volatility Premium ETF (SVOL)
ETF.com says there are 13 VIX-related ETFs, but one that particularly intrigues me (and yes I already own some) is SVOL. In general, ETFs that play volatility are special-use or very short-term instruments and I steer clear of them. I prefer to play volatility with individual stock, ETF, or VIX options. But SVOL is different. It is essentially an income fund, not a trading vehicle.
Yes, that was not a typo. SVOL's allure is its yield and it gets a large part of that yield from shorting volatility futures and pocketing money on the rolls each month. It supplements that with yields from other high-quality holdings.
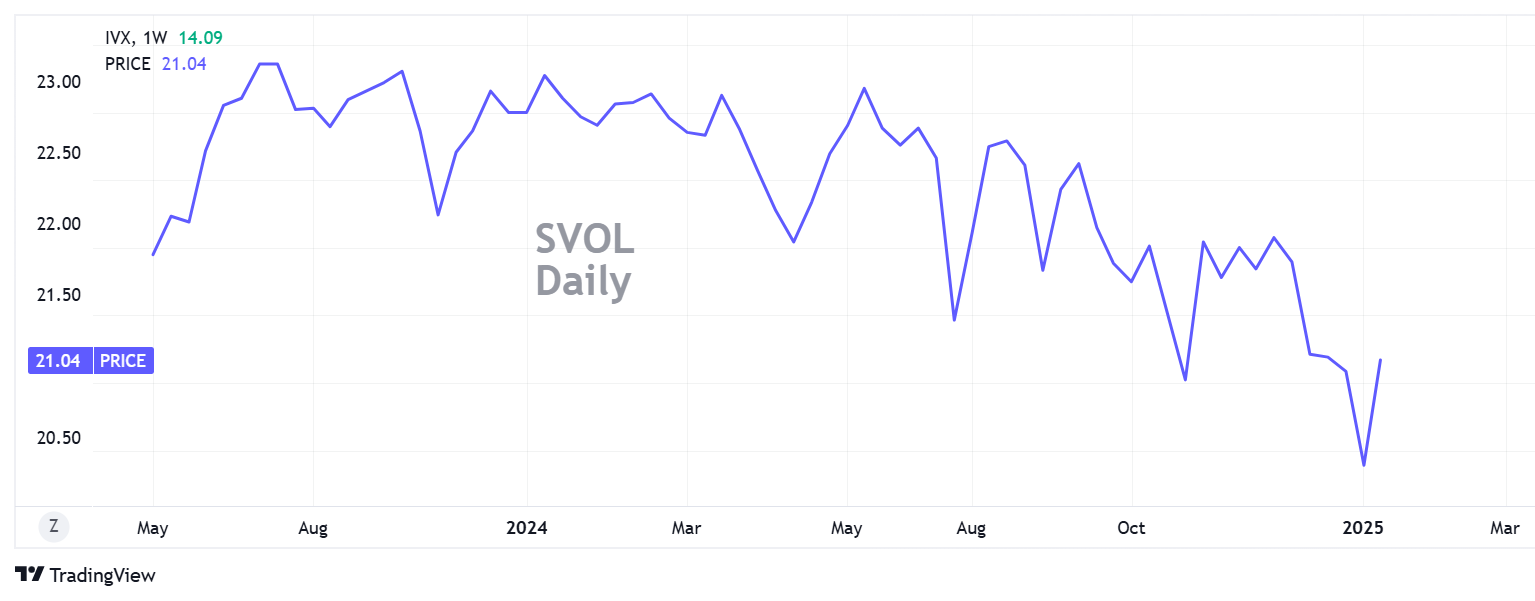
Its value will dip slightly during big volatility spikes in the S&P and then move up slightly as the volatility in the S&P retreats. Its own price volatility, however, is somewhat low. During its 18-month life, it has been as high as 23 and as low as 20.34. (Morningstar classifies SVOL as "low" risk.)
I offer this intro to SVOL as education and not as a buy recommendation. SVOL can be another tool that you can use when it fits with your strategy. After a spike in VIX, you can get a hefty monthly dividend from SVOL and a slight rise in value as VIX subsides. The price declines very slightly over time, but since its inception, it's down just 7% over 18 months. Meanwhile, it was paying and an annualized dividend of around 15%, paid monthly. As such, I don't view it as a permanent hold, but it makes for a way to generate a nice yield when VIX is elevated or spiking and subsequently retreats.
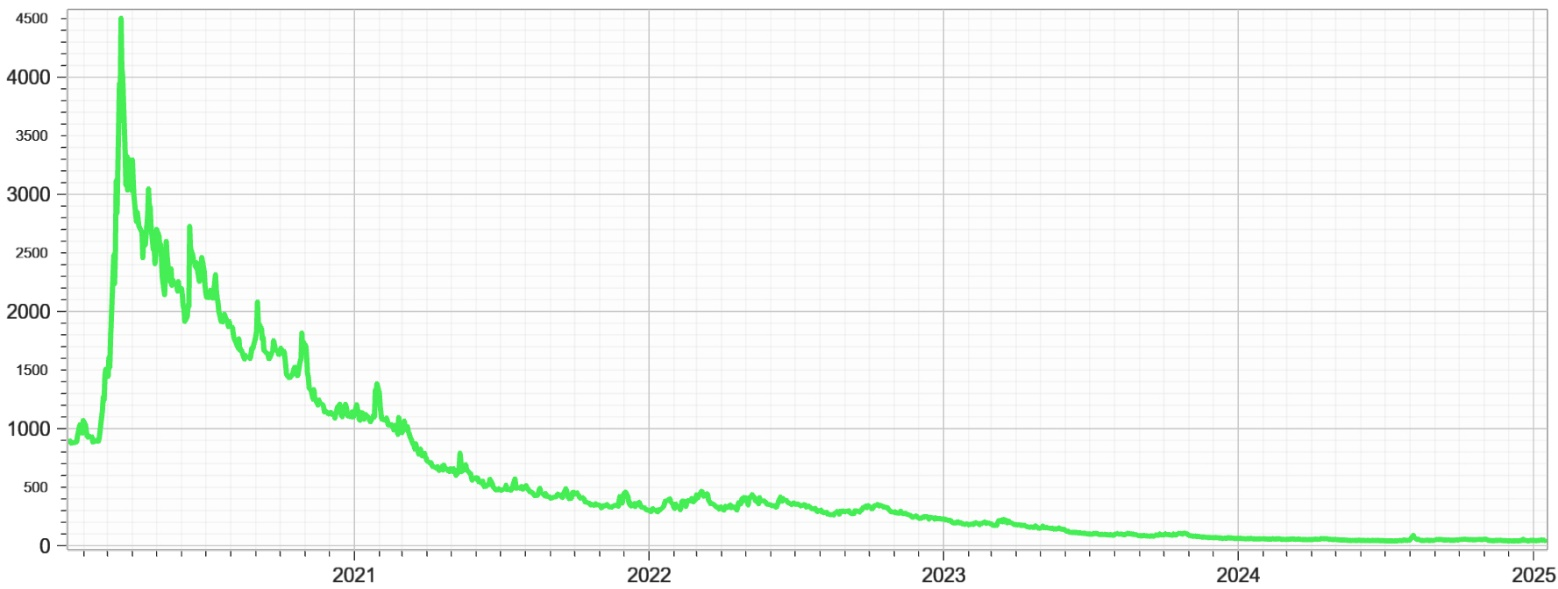
ETFs that play VIX futures on the long side have been around for a while but they use a lot of leverage and they are typically long VIX futures. A standard one is VIXY, which holds nothing but long positions in short-duration VIX futures. Here is a chart.

Exciting, isn't it? – an instrument that basically loses money every month for years until there may be a huge spike in volatility. Any respectable trader or investor would look at this and ask "How can I short it?" Unfortunately you cannot short it. Nor would you want to because when the 'big one' comes, you could be clobbered.
Recognizing this, the folks at Simplify Asset Management came up with something clever. They created SVOL to hold a modest amount of short VIX futures positions, so they pull in money most months when they roll their position forward (the opposite of what VIXY does). They do that with part of the portfolio and mix that with income from other securities.
A chart of SVOL since inception in May 2023 is below.

There are a couple of things I do not like about SVOL. First, their management fee is 70 bps, which is high for ETFs. Secondly, the portfolio contains a lot of Simplify's other ETFs, which means they are double-dipping by getting fees on those as well.
But in the end, SVOL has proven useful to me, so I thought I'd mention it.
For further info on SVOL, its fact sheet can be found here.
Got a question or a comment?
We're here to serve IVolatility users and we welcome your questions or feedback about the option strategies discussed in this newsletter. If there is something you would like us to address, we're always open to your suggestions. Use rhlehman@ivolatility.com.
Previous issues are located under the News tab on our website.